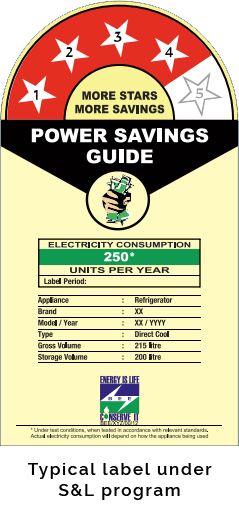
About Standards and Labelling Program (S&L)
The Standards and Labelling program was launched in May 2006. The program provides consumers with information about the energy-saving and therefore the cost saving potential of the labelled appliances. It provides performance labels for appliances using a star rating system, in which a higher star rating implies greater energy efficiency.


Methodology adopted for calculating energy savings under the Standards and Labelling scheme
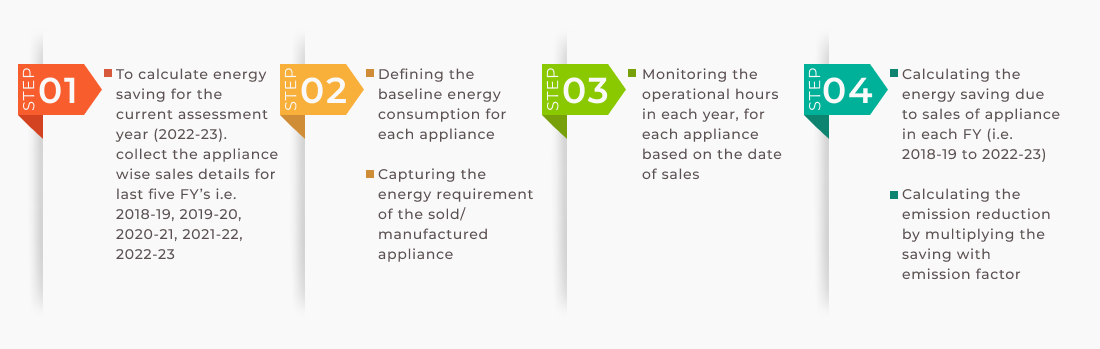
Methodology adopted for the evaluation of the impact of the Standards & Labelling programme is described in the following steps.
**Assumptions:
1. A life cycle of an appliance is four years.
2. For appliance sale, the proxy used is number of appliances produced. We don’t keep track of distribution and sales of appliances and hence can’t measure state wise energy savings from standards and labelling.
STEP 1: Sales Volumes of Star Labeled Appliances
Appliances considered for S&L impact assessment
To evaluate the impact of the S&L programme the production data must be captured for the registered appliances under the S&L program. Till 31st March 2023; 34 appliances were registered under the programme, out of which 21 have significant production volume based on data reported under the programme. For the other 13 appliances, the recorded production volume is presently low, and consequently, the savings accrued due to these appliances is not significant. These appliances are presently included under the voluntary category. A list of the 21 appliances being considered for impact assessment is presented in Table 1:
Table 1: List of appliances covered under S&L programme for energy savings calculations
You will get more details on the data visualization tab on number of appliances produced. It can be inferred from the above analysis that:
1. During the FY 2022-23, the highest percentage of appliances labeled with 5 stars pertains to washing machines, with deep freezers, open well pump sets, and electric water heaters following closely behind. This indicates a noteworthy emphasis on energy-efficient features in the manufacturing of washing machines during this period.
2. In the FY 2022-23, the largest percentage of appliances labeled with just 1 star includes TFL (Tubular Fluorescent Lamp), with domestic LPG stoves, ceiling fans, and distribution transformers ranking subsequently. This suggests that, within the 1-star category, TFL appliances were particularly prevalent in the market, potentially influencing consumer choices and manufacturing trends.
3. The sales data for the fiscal year 2022-23 highlights a distinct trend in the popularity of appliances based on their star ratings. The highest number of units sold corresponds to 2-star labeled appliances, followed sequentially by 3-star, 1-star, 5-star, and 4-star appliances. This information provides valuable insights into consumer preferences and purchasing patterns, indicating a significant demand for appliances with moderate energy efficiency, as reflected in the prevalence of 2-star rated products in the market.
STEP-2: Defining the baseline
For evaluation of the energy savings, defining of the energy consumption baseline is very crucial for the appliances under consideration. Each appliance is separately notified under S&L program and the date of initial notification and energy consumption parameters are separate for each appliance. Savings from the different appliances are evaluated by multiplying the sales volumes of the respective star rating with the energy saving potential i.e. Annual Energy Savings = (Baseline Value- Actual Value) x Production x Operating hours x (1-T&D losses)
Details of baseline energy consumption for different appliances are presented in Table 2.
Table 2: Baseline energy consumption for appliances
STEP-3: Defining the operating hours
Energy saving for the appliances covered in the S&L Programme in the FY 2022-23
Energy Savings= {Annual Energy consumption by appliance as defined by baseline (kWh)- Annual energy consumption of star rated appliance (kWh)}
* number of respective star- labeled appliances produced during the FY 2018 – 23
* annual operational hours of the appliance as defined under the S&L program
Energy saving for the FY 2022-23 is calculated considering the production of the appliance on quarterly basis. For example, if Variable AC is having the 1600 annual operation hours, appliance manufactured in Q1 can be operated for 100% of the operational hours i.e. 1600 hours, and if appliance is manufactured in Q2, then appliance can operate to max of 75% of the available operation hours i.e. 1125 hours; if appliance is manufactured in Q3 then it can only work for 50% of the annual operation hours for that FY i.e. 750 hours; and if manufacturing occurs in Q4 then appliance can only work for 25% of operation hours during that particular FY i.e. 375 hours. Assuming a 4-year or 16-quarter lifespan for the appliance, our analysis takes into account 100% of the operational hours for appliances sold in fiscal years 2019-20, 2020-21, and 2021-22. It is essential to highlight that, for the fiscal year 2018-19, appliances sold in Q1 have already completed their average lifespan by FY 2022-23. Consequently, the energy savings associated with these Q1 appliances in FY 2018-19 are not included in this year’s calculations.
Similarly, appliances sold in Q2 of FY 2018-19 operated for 15 quarters within the 2018-23 timeframe, with one quarter of their average lifespan remaining. As a result, appliances from Q2 of FY 2018-19 only contributed 25% of total annual running hours, e.g., 8760 in FY 2022-23, and consequently, their contribution to total energy savings in FY 2022-23 is also limited to 25%. For appliances sold in Q3 and Q4 of FY 2018-19, they operated at full capacity from 2019-22. Despite this, they still have 2 and 3 quarters of their 4-year lifespan left, respectively.
Consequently, appliances from Q3 and Q4 of FY 2018-19 only accounted for 50% and 75% of the total annual hours in FY 2022-23. Correspondingly, their contribution to energy savings is proportionate, standing at 50% and 75% of their running hours, respectively, in FY 2022-23. Accordingly, the contribution of appliances to savings will vary proportionality.
Accordingly, the contribution of appliances to savings will vary proportionality. Details of the operation hours for the different appliance is defined in the table below:
Table 3: Annual operation hours for appliance
STEP 4: Estimation of the energy savings and emission reduction
 Energy saving for each appliance is calculated using the formula defined in step 2 and operating hours defined in step 3. Energy saving for the different appliances can be viewed in the data visualization tab.
Direct Cool and Frost Free Refrigerator, Room ACs, Color TV, and pump sets contribute to 75% of the savings due to sales of the appliances under S&L programme.
Emission reduction by the initiatives under the programme is evaluated considering the grid emission factor of 0.82 kg of CO2 emission reductions per kWh of the energy saved
Please note that Saving due to LED lights is not considered, in total saving are projected under UJALA program.
Total reduction is 58.24 Mn tonne of carbon dioxide during FY 2022-23.